> For the complete documentation index, see [llms.txt](https://docs.aporia.com/llms.txt). Markdown versions of documentation pages are available by appending `.md` to page URLs; this page is available as [Markdown](https://docs.aporia.com/v1/integrations/new-relic.md).
# New Relic
Aporia allows you to connect alerts generated from Aporia’s monitors to New Relic’s Incident Intelligence engine and the predictions data in order to create a comprehensive monitoring dashboard in New Relic for your models in production.
### Integrate New Relic with Aporia
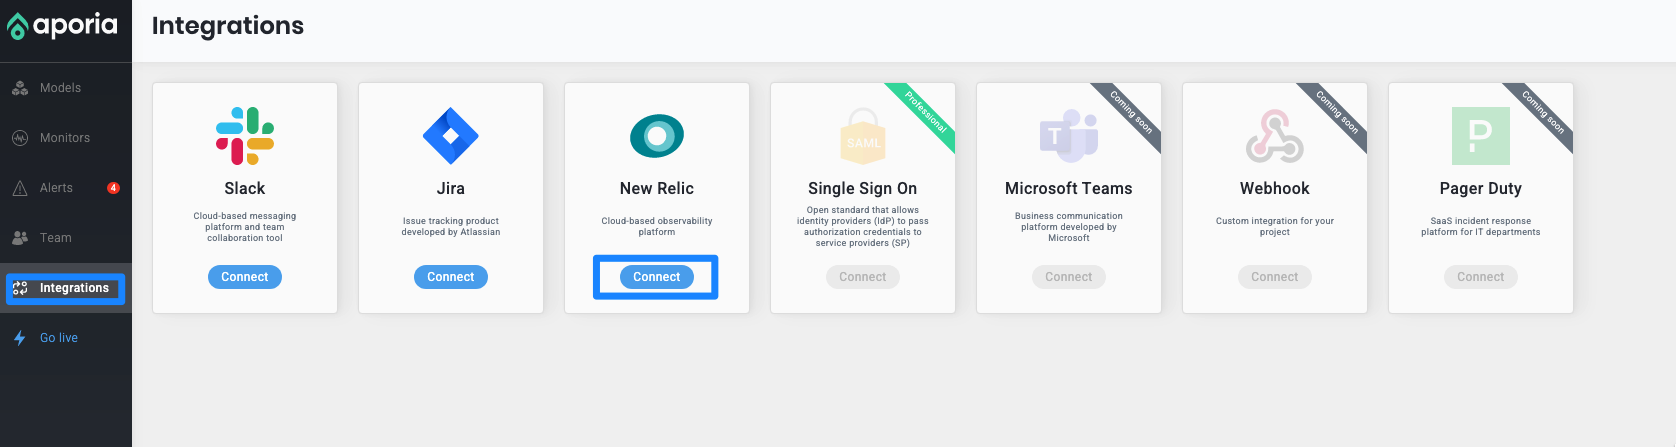
1. Log into Aporia’s console. On the navbar on the left, click on **Integrations** and choose **New Relic**.\
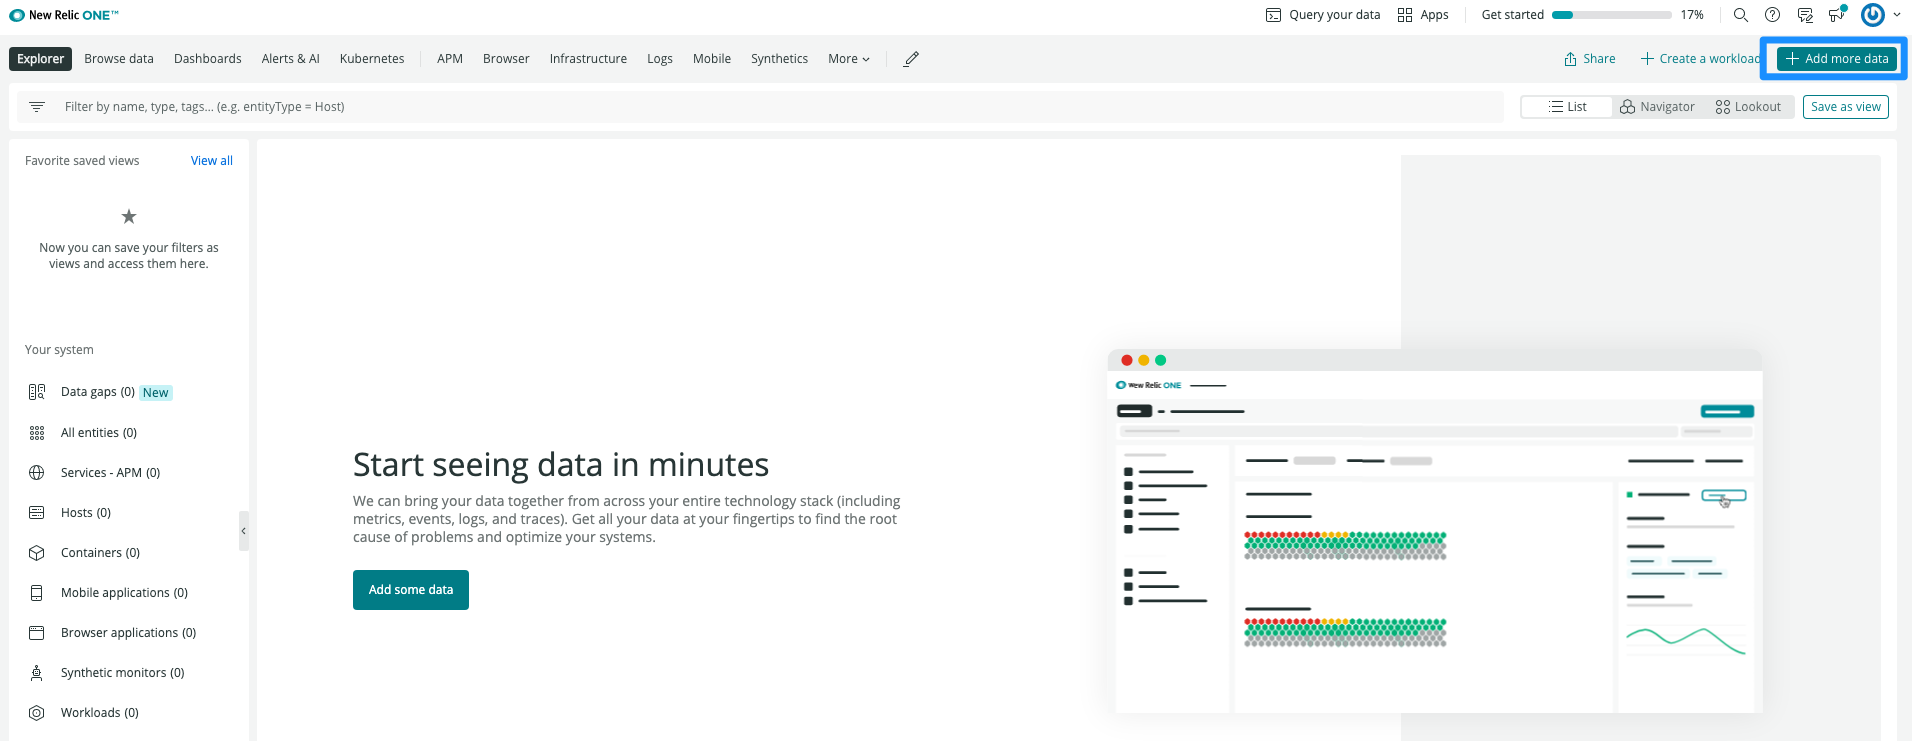
2. Log into your New Relic account, and click on **+ Add more data**.
3. In the search bar type **Aporia** (or scroll down to the **MLOps Integrations** section) and click on the **Aporia** icon.
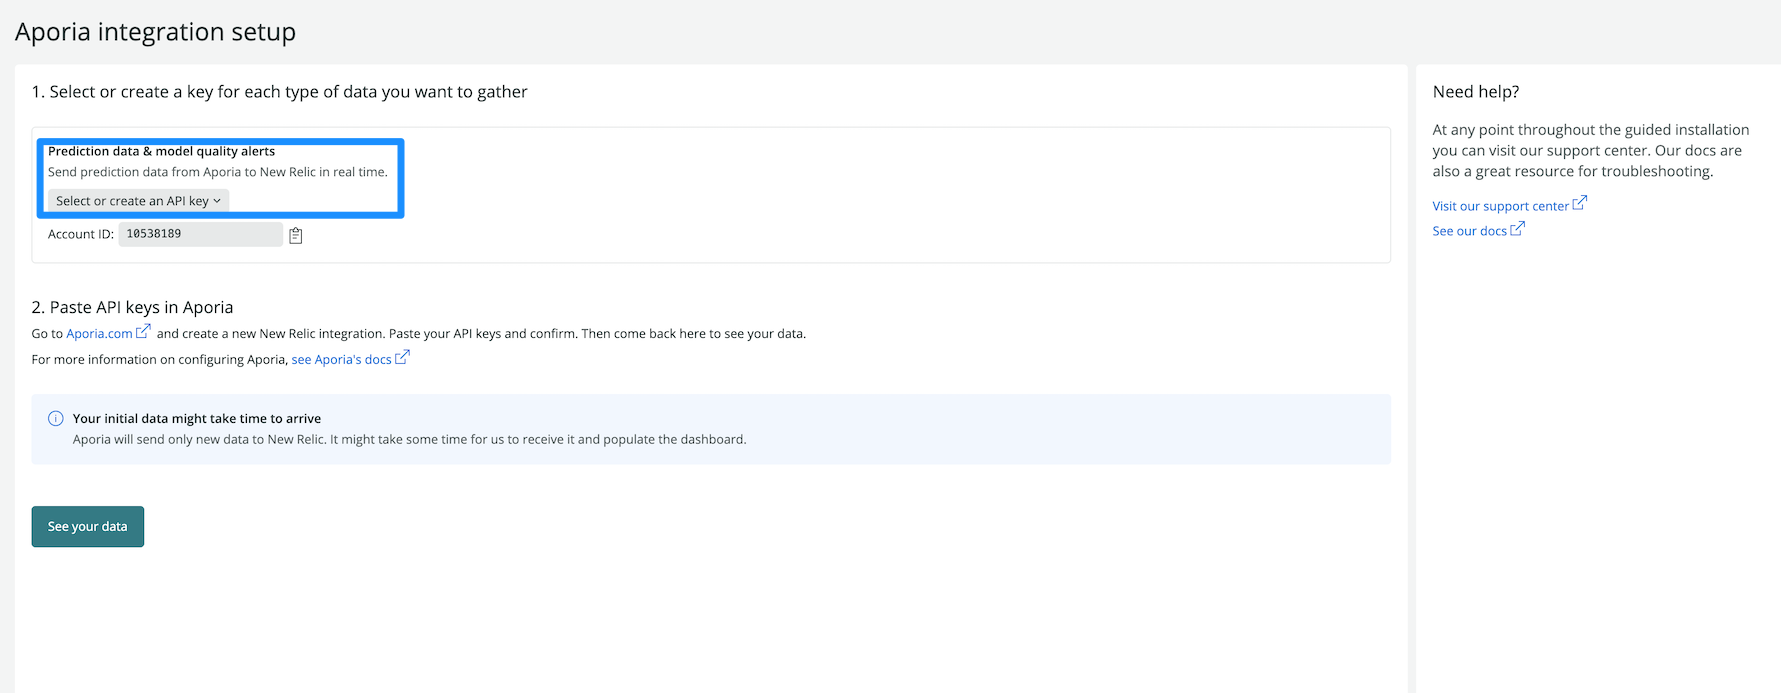
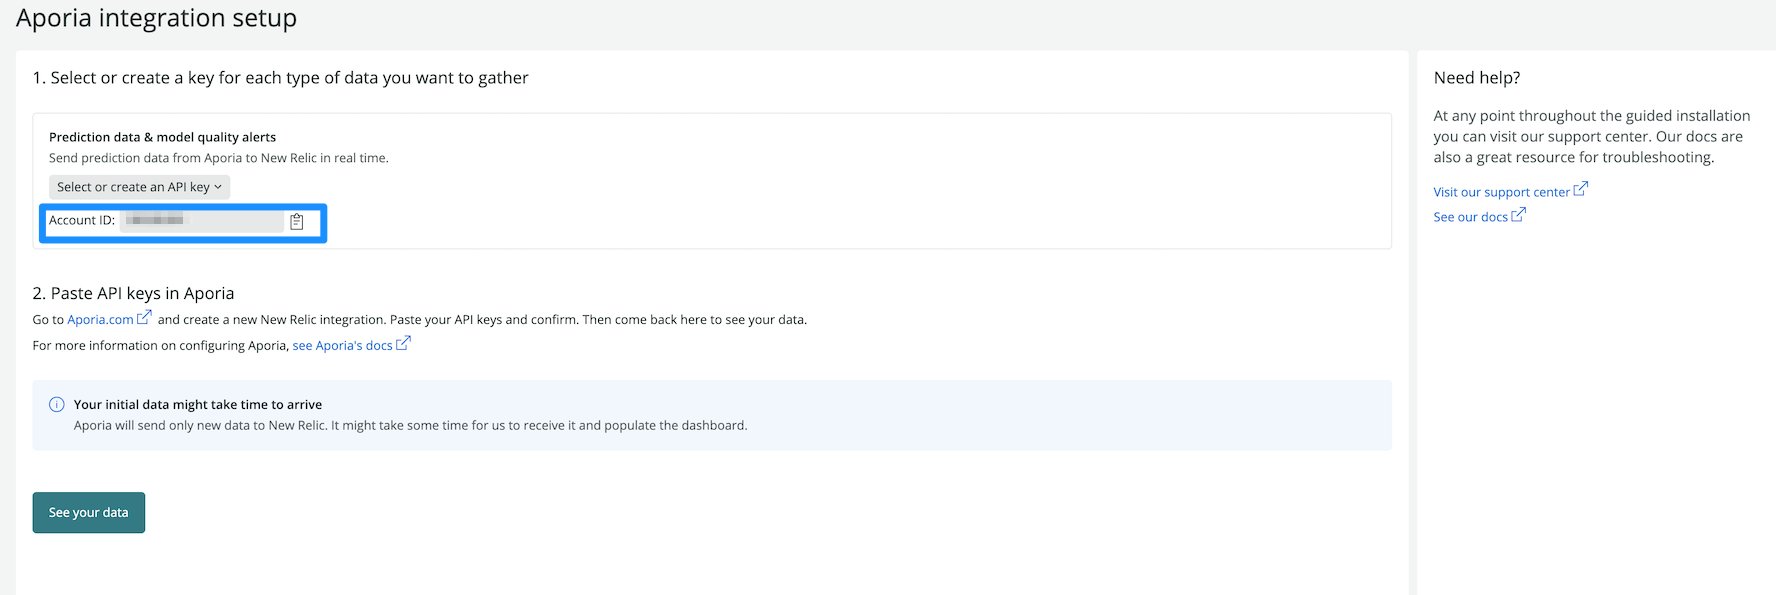
1. Under **Prediction data**, click the **Select or create API key** to create a new API key or use an existing one.
1. After creating the token, click on the copy symbol to copy the token.
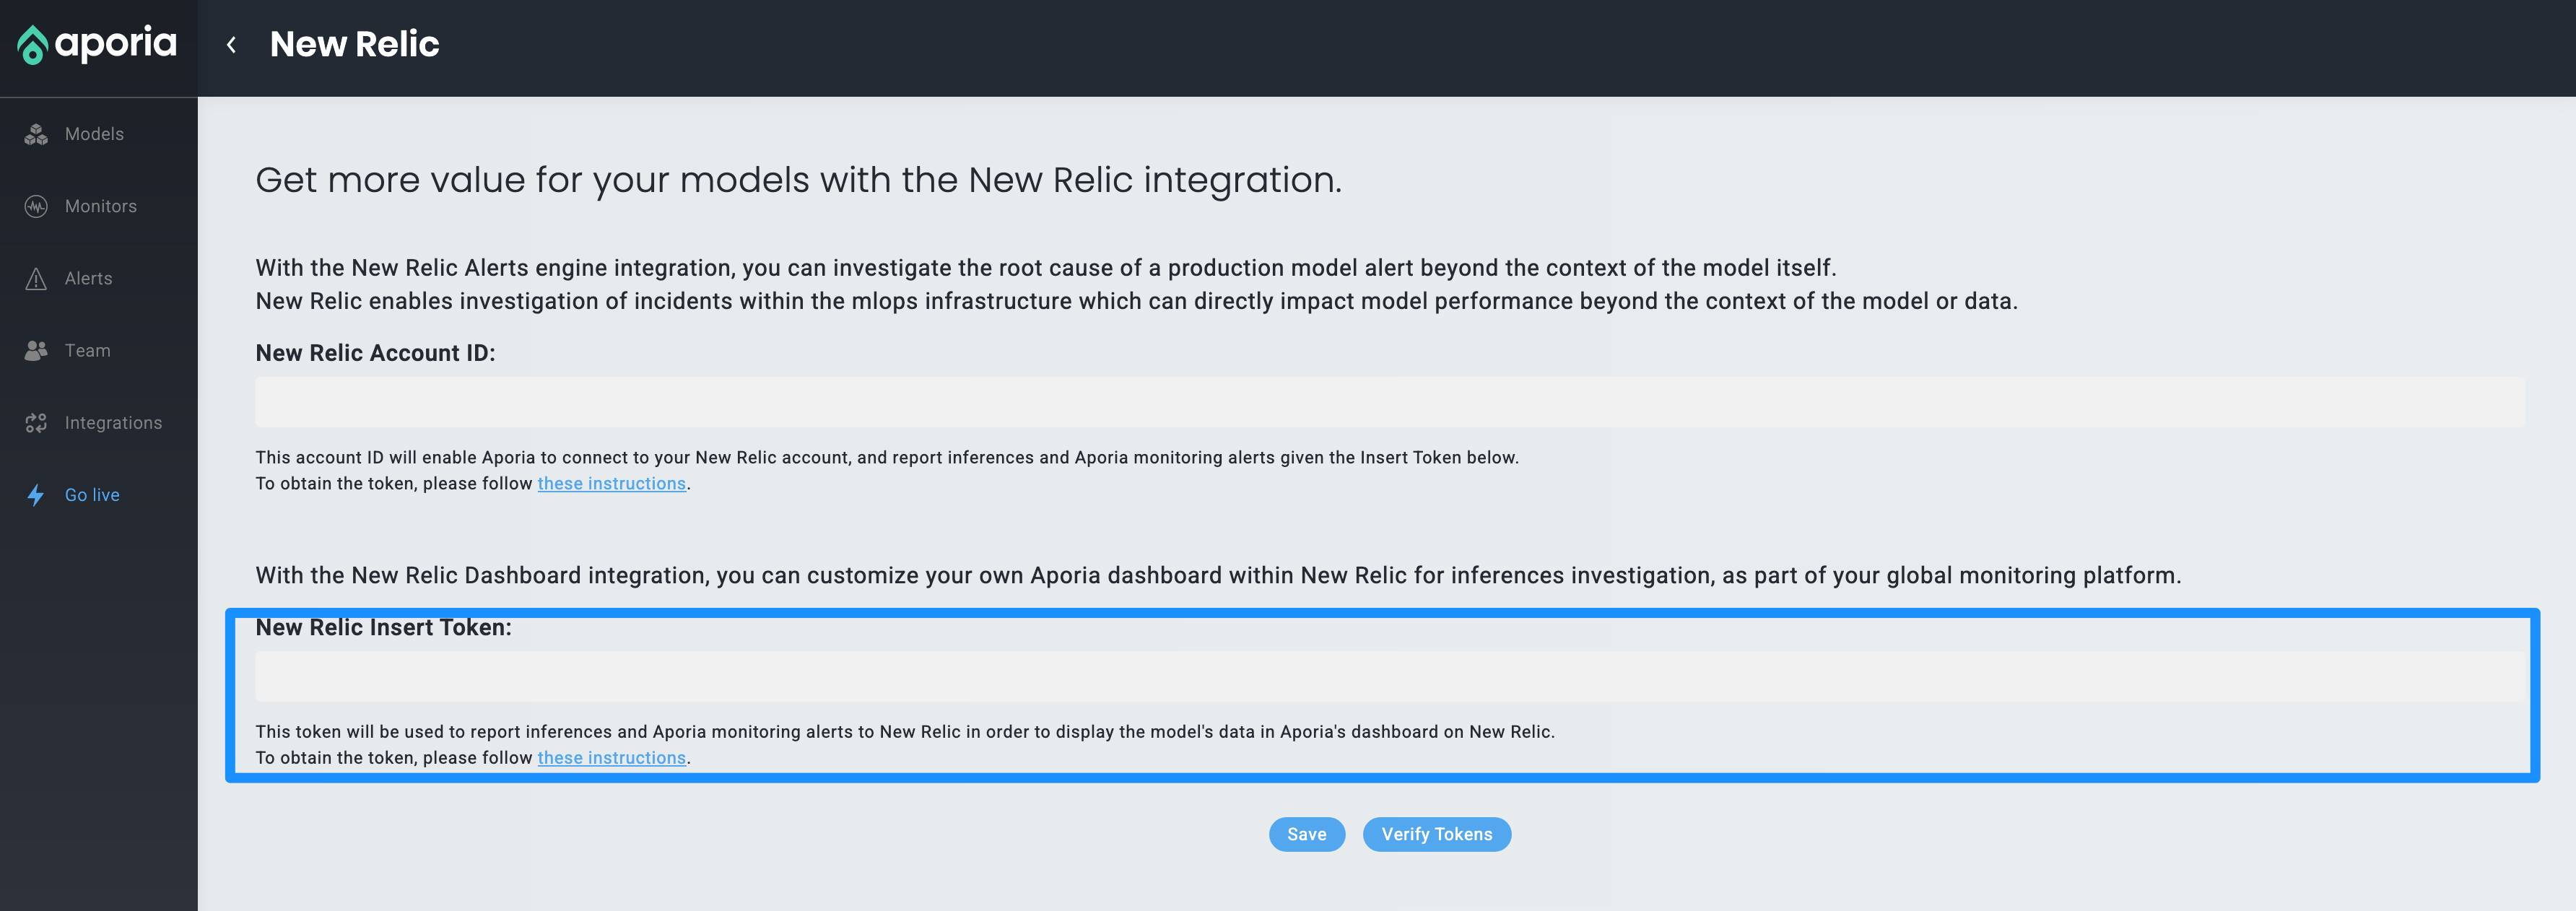
2. Then go back to the Aporia dashboard and paste the token under **New Relic Insert Token**.
3. Return to the New Relic dashboard. Copy the account ID.
4. Go back to the Aporia dashboard and paste it under **New Relic Account ID**. 
5. In the Aporia dashboard, click on the **Verify Tokens** button to verify both tokens are working correctly. Green check marks or red error marks should appear to indicate the status. 
6. Once everything is set, click on the **Save** button.
7. Return to the New Relic dashboard and click on the **See your data** button. This will redirect you to a dashboard displaying data reported to Aporia in New Relic. 
**Congratulations: You’ve now successfully integrated Aporia with New Relic!**
#### Easy data filtering – Monitoring Platform for Machine Learning Models
You can make it easy to filter the data, on both the **Most Active Models** chart and the **Most Active Model Versions** chart by making the adjustments shown below:
1. Click on the **…** symbol and click **edit**. 
2. On the right navbar, under **User as filter** activate **Filter the current dashboard** and click **Save**.
### Additional ML Graphs
Additional graphs display statistics over the predictions reported:
1. The **Model Inferences** graph displays the number of unique inferences reported for each model and version.
2. The **Average Numeric Inferences** graph displays the average value numeric inferences reported for each model and version.
3. The **Numeric Inferences Heatmaps** graph displays heatmaps of the numeric inferences values reported for each model and version.
4. The **Categorical Inferences** graph displays the different unique values and their frequencies of categorical predictions reported for each model and version.

### Alerts and Applied Intelligence for ML models
When a new alert is detected by Aporia, it will be reported to New Relic’s Incident Intelligence engine. To view these alerts in New Relic, click on **Alerts & AI** and on the left navbar click on **Issues & activity**.

On this page you will be able to see the correlated alerts. Clicking on an issue will open a screen with additional data, including all the related activities to the issue and their payloads.

Newly created alerts will now be correlated with your New Relic alerts and you should be able to see data about newly reported predictions.
Happy Monitoring!